Journal of Addiction Medicine and Therapeutic Science
Impact of income on the structure of alcohol sales in Russia
Department of Medico-Biological Problems of Alcoholism, Institute of Biochemistry, Academy of Science of Belarus, Belarus
Author and article information
Cite this as
Razvodovsky YE (2021) Impact of income on the structure of alcohol sales in Russia. J Addict Med Ther Sci. 2021; 7(1): 010-012. Available from: 10.17352/2455-3484.000049
Copyright License
© 2021 Razvodovsky YE, et al. This is an open-access article distributed under the terms of the Creative Commons Attribution License, which permits unrestricted use, distribution, and reproduction in any medium, provided the original author and source are credited.Significant changes in the structure of alcohol consumption, as well as changing economic cycles, make Russia a convenient object for studying the impact of the population’s income on the structure of alcohol consumption. The aim of this study was to study the relationship between income and the structure of alcohol sales in Russia at the population level.
Methods: A comparative analysis of the dynamics of the gross domestic product (GDP) and the level of sales of various types of alcoholic beverages/the structure of alcohol sales in Russia in the period from 1990 to 2015 was carried out. Statistical data processing was carried out using the STATISTICA 10 package.
Results: According to the results of the correlation analysis, GDP is negatively correlated with the sale of vodka (r = -0.63; p <0.000)/the share of vodka in the sales structure (r = -0.8; p <0.000) and positively correlates with beer sales (r = 0.5; p <0.000)/share of beer in the sales structure (r = -0.72; p <0.000), as well as with wine sales (r = 0.73 ; p <0.000)/share of wine in the sales structure (r = 0.67; p <0.000).
Conclusions: The improvement of the macroeconomic situation and the growth of incomes of the population was one of the drivers of the change in the structure of alcohol consumption in Russia in favor of low-alcohol drinks.
The level and structure of alcohol consumption is determined by a number of factors, one of which is the level of income [1]. A number of studies have shown the impact of the state of macroeconomics and economic cycles on the level of alcohol consumption [2,3]. The study of the relationship between the level of alcohol consumption and GDP, based on data from 189 countries of the world, showed that consumption increases linearly with the growth of GDP to 15 thousand dollars, while further GDP growth does not affect the level of alcohol consumption [2].
Studies conducted in Russia have found a positive correlation between income and alcohol consumption at the individual level [4,5]. In particular, it was shown that income growth is accompanied by an increase in the overall level of alcohol consumption due to an increase in both the frequency of consumption and the dose of alcohol consumed [4]. In another work based on Russian data, a direct relationship was demonstrated between the level of income and the level of vodka consumption [5].
One of the main factors of the high level of alcohol problems in Russia is traditionally considered the binge drinking pattern of alcohol consumption, which is characterized by the consumption of large doses of strong alcohol within a short period of time [7-9]. However, according to the official statistics of alcohol sales, as well as the results of sociological surveys, since the mid-1990s in Russia, there is a decrease in the share of vodka in the consumption structure against the background of an increase in the share of beer and wine [10-13]. Similar changes in the structure of alcohol consumption are noted in other countries where the binge drinking pattern of alcohol consumption prevails, which correspond to the global trend of homogenization of styles of alcohol consumption [7].
Significant changes in the structure of alcohol consumption [10-13], as well as changing economic cycles [6], make Russia a convenient object for studying the impact of the level of income of the population on the structure of alcohol consumption. In one of the previous econometric studies carried out in Russia at the individual level, it was shown that as the level of income rises, the demand for spirits decreases, while the demand for beer and wine grows [4].
The aim of this study was to study the relationship between income and the structure of alcohol sales in Russia at the population level.
Materials and methods
A comparative analysis of the dynamics of GDP and the level of sales of various types of alcoholic beverages/structure of alcohol sales in Russia in the period from 1990 to 2015 is carried out. GDP data (integral indicators of economic activity and living standards) are taken from the World Bank database. Since GDP in Russia is closely correlated with the level of average wages, this index can be considered an approximate indicator of the level of income of the population. Sales data for various types of alcoholic beverages were obtained from the Rosstat database.
Statistical analysis was carried out using the STATISTICA 10 package. To check the normal distribution of the time series, the Kolmogorov-Smirnov test was used. Since the distribution of the values of the studied time series differs from the normal one, the statistical analysis was carried out using the nonparametric method (Spearman correlation analysis).
Results
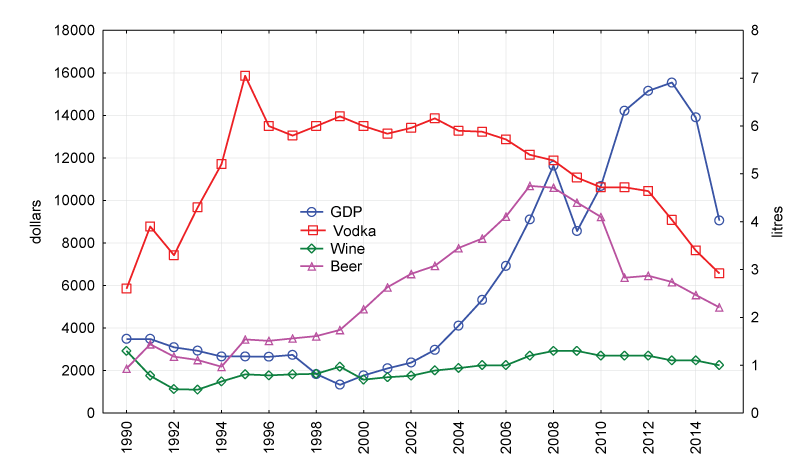
The dynamics of GDP and the level of sales of various types of alcoholic beverages are shown in Figure 1. Graphical evidence indicate that GDP gradually decreased until 1998, then grew exponentially until 2008, then significantly increased in subsequent years, reaching a peak in 2013 year, after which it dropped sharply. The level of vodka sales rose substantially in the first half of the 1990s, peaking in 1995, then declining slightly, stabilizing at about 6 liters per capita, and after 2003 began to decline. The level of beer sales rose significantly between 1999 and 2007, after which it began to decline. Wine sales declined in the first half of the 1990s, then stabilized at about one liter, then increased slightly between 2001 and 2008, and then began to decline again.
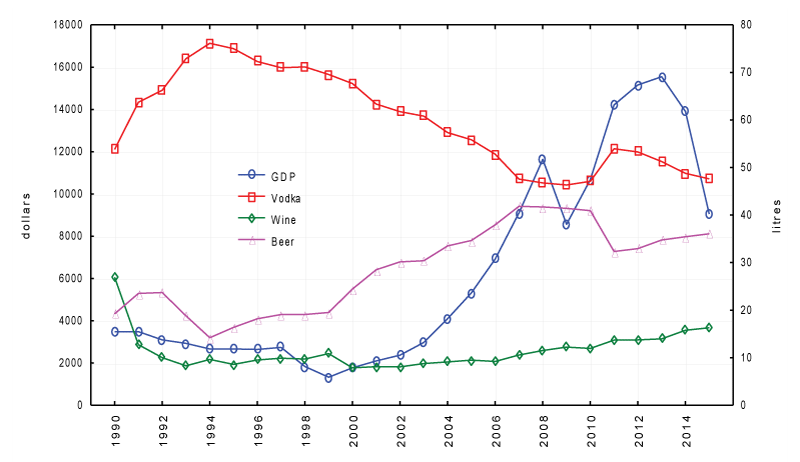
Figure 2 shows the dynamics of GDP and the share of various alcoholic beverages in the structure of alcohol sales. The share of vodka in the structure of alcohol sales increased significantly in the first half of the 1990s, and then decreased until 2009. After some growth in 2011, this indicator continued to decline. The share of beer in the structure of alcohol sales increased substantially in the period from 1999 to 2007, after which this indicator first stabilized, and then slightly decreased. The share of wine in the sales structure increased significantly in the period from 2006 to 2015.
According to the results of the correlation analysis, GDP negatively correlates with the sale of vodka (r = -0.63; p <0.000)/the share of vodka in the sales structure (r = -0.8; p <0.000), positively correlates with the sale of beer (r = 0.5; p <0.000)/share of beer in the sales structure (r = -0.72; p <0.000), as well as with the sale of wine (r = 0.73; p <0.000)/share of wine in the sales structure ( r = 0.67; p <0.000).
Discussion
The results of the time-series analysis reproduce the data obtained earlier, indicating the existence of a negative relationship between income and the sale of vodka, as well as a positive relationship between income and the sale of beer/wine at the population level [4]. The presented data indicate that the income growth is accompanied by a decrease in the share of vodka in the structure of alcohol sales and an increase in the share of beer and wine.
It should be noted, however, that in certain time intervals of the period under consideration, the nature of the relationship between income and the sale of various alcoholic beverages does not correspond to the revealed general pattern. For example, in the period from 2009 to 2013 the level of beer sales declined amid rising income. In the last two years of the period under review, the level of sales of all alcoholic beverages declined amid falling income. These discrepancies point to the existence of some unaccounted factors other than income levels that influence the pattern of alcohol sales.
It is believed that the main factors behind the sharp increase in the level of sales of vodka in the first half of the 1990s where: the growth of its physical availability in connection with the abolition of the state alcohol monopoly in 1992 and the lag in the growth of prices for vodka in comparison with basic food products [6]. A certain role in this process was played by the anti-alcohol campaign in 1985-1988, within the framework of which the production of wine was sharply reduced [5]. The decline in beer sales that began in 2007 and the acceleration of the downward trend in vodka sales is most likely explained by the combined effect of a set of government measures to strengthen regulation of the alcohol market and the economic crises of 2009 and 2013 [10,14]. A similar situation took place in Estonia, where the decline in alcohol consumption, which began after 2007, was the result of the combined effect of the global financial and economic crisis in 2008 and an increase in the excise tax on alcohol [15].
The beginning of the so-called “beer revolution” in 1999 correlates with the aggressive advertising campaign for beer against the background of the introduction of a ban on advertising of vodka in the media [12]. In subsequent years, international campaigns developed the Russian beer industry, making large investments and increasing production [13]. The most significant changes in the structure of alcohol sales in favor of beer were noted in the period from 1999 to 2007 against the background of significant growth in GDP and real incomes of the population.
The change in the structure of alcohol consumption in Russia took place in the context of changes in alcohol preferences by various social and age groups. It was noted that representatives of the younger generation prefer beer, and those with a higher level of education replace the consumption of vodka with wine [12]. There is also a tendency towards a shift in vodka consumption to older age groups [13]. These data point to the important role of cultural factors in changing the structure of alcohol consumption, noted in Russia in the post-Soviet period.
The limitation of this study is the lack of reliability of the official statistics on alcohol sales. This is especially true of vodka, a part of the sales volume of which is not recorded by official statistics [6]. The relatively high proportion of unrecorded alcohol makes it difficult to study the influence of various factors on the structure of alcohol consumption in Russia [11].
In conclusion, this study found a negative relationship between income and sales of vodka/the share of vodka in the structure of alcohol sales, as well as a positive relationship between income and sales of low alcohol drinks (wine and beer) at the population level. These suggest that the improvement of the macroeconomic situation and the growth of incomes of the population was one of the drivers of the change in the structure of alcohol sales in Russia in favor of low-alcohol beverages.
- Dee TS (2001) Alcohol abuse and economic conditions: evidence from repeated crosssections of individual-level data. Health Econ. 10: 257-270. Link: http://bit.ly/3tf7AsO
- Shield KD, Rehm M, Patra J, Sornpaisarn B, Rehm J (2011) Global and Country Specific Adult per capita Consumption of Alcohol, 2008. 57: 99-117. Link: https://bit.ly/3rFfE5G
- Harhay MO, Bor J, Basu S, McKee M, Mindell JS, et al. (2013) Differential impact of the economic recession on alcohol use among white British adults, 2004–2010. Eur J Public Health. 24: 410-415. Link: http://bit.ly/3qGs0sW
- Andrienko YV, Nemtsov AV (2006) Estimation of individual demand on alcohol. Scietific works CEFIR and RES. №89. 47. (in Russ).
- Kolosnitsyna М, Chorkina N, Dorziev C (2015) Effect of pricing measures of state alcohol policy on consumption of alcoholic beverages in Russia. Economic Policy. 10: 171-190. (in Russ). Link: https://bit.ly/3cpcHQ7
- Nemtsov AV (2009) Alcohol hystory in Russia: new period. M. Librocom. (In Russ).
- Moskalewicz J, Razvodovsky YE, Wieczorek P (2016) East-West disparities in alcohol-related harm. Alcoholism and Drug Addiction. 29: 209-222. Link: http://bit.ly/3qGxFPq
- Razvodovsky YE, Smirnov VY, Zotov PB (2015) Forecasting of suicides rate using time series analysis. Suicidology. 6: 41-48. (In Russ).
- Razvodovsky YE (2016) Alcohol and suicides in Russia, Ukraine and Belarus: a comparative analysis of trends. Suicidology. 7: 3-10. (In Russ).
- Radaev V, Kotelnikova Z (2016) Changes in the structure of alcohol consumption in the context of state alcohol policy in Russia. Economic Policy. 11: 92-117. (In Russ).
- Radaev V (2015) Impact of a new alcohol policy on homemade alcohol consumption and sales in Russia. Alcohol & Alcoholism. 50: 365-372. Link: http://bit.ly/38A8tUR
- Roschchina YM (2012) Dynamic and structure of alcohol consumption in contemporary Russia. Proceedings of Russian monitoring of economic situation and public health. NIU HSE. 2: 238-257. (In Russ).
- Tapilina V (2006) How much drink Russia? Volume, dynamic and differentiation of alcohol consumption. Sociological Researches. 2: 85–94. (In Russ).
- Nemtsov AV, Razvodovsky YE (2016) Russian alcohol policy in false mirror. Alcohol & Alcoholism. 51: 626-627. Link: http://bit.ly/38Ai2mu
- Lai T, Habicht J (2011) Decline in alcohol consumption in Estonia: combined effects of strengthened alcohol policy and economic downturn. Alcohol Alcoholism. 46: 200-203. Link: https://bit.ly/3cmAvEp
Article Alerts
Subscribe to our articles alerts and stay tuned.
 This work is licensed under a Creative Commons Attribution 4.0 International License.


 Save to Mendeley
